


Home / Training / Manuals / Atlas of breast cancer early detection / Learning
.png)
Click on the pictures to magnify and display the legends

Click on this icon to display a case study
Atlas of breast cancer early detection
Filter by language: English / РусскийBreast imaging Breast ultrasound Equipment: Basic components and functioning |
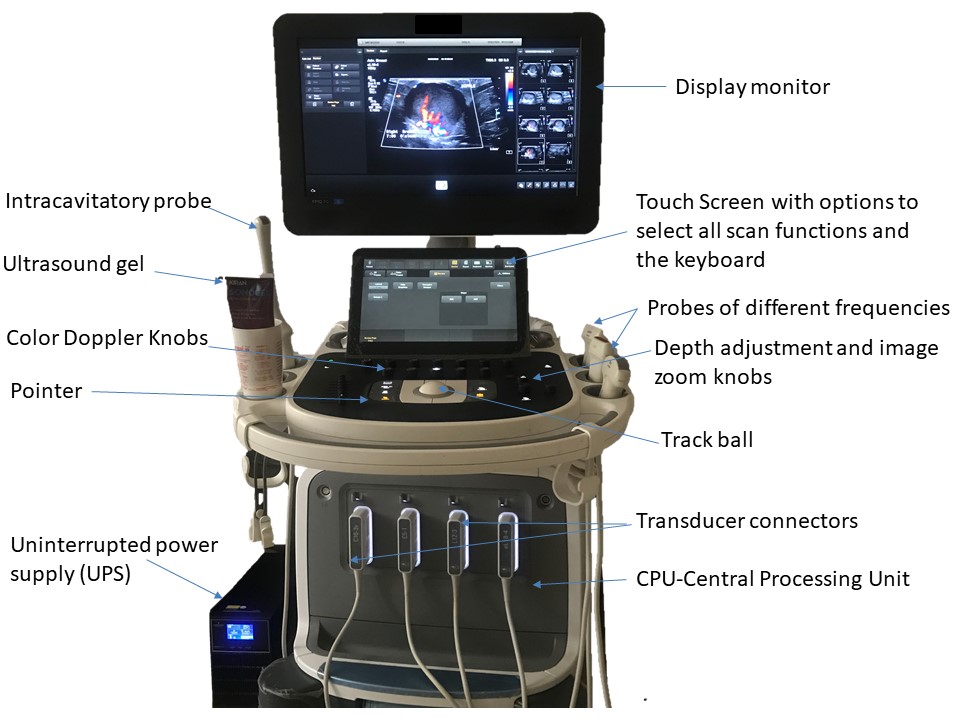
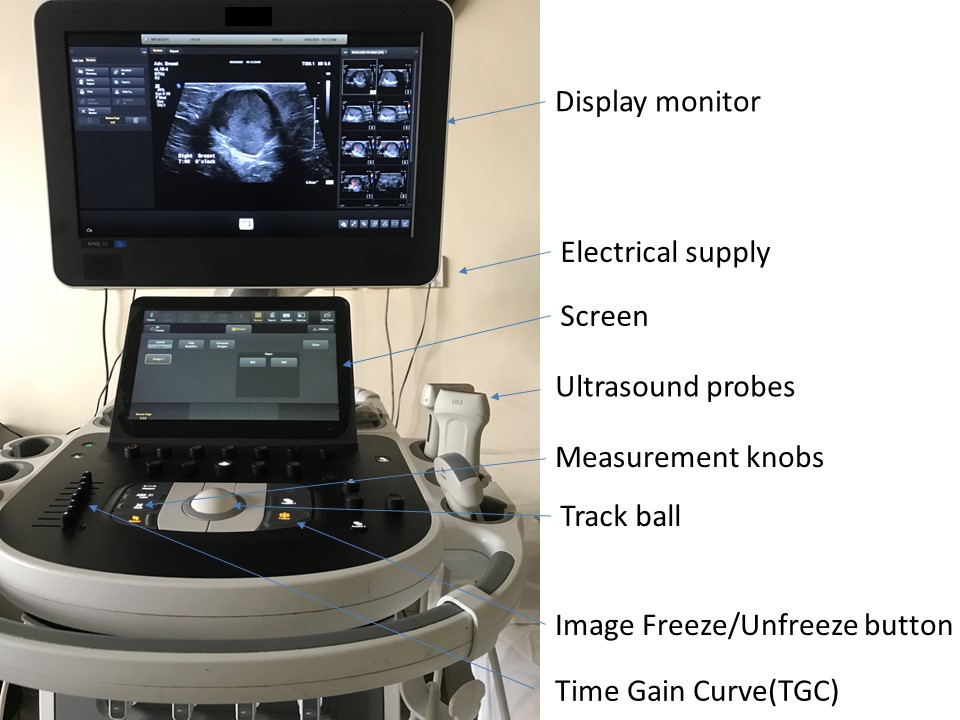
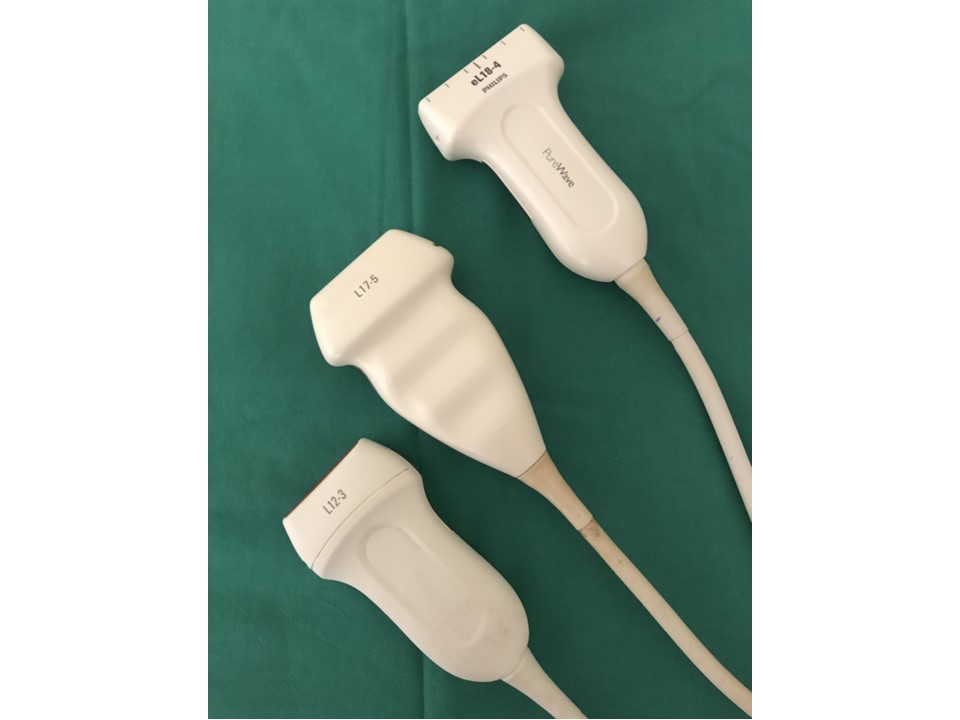
Description of ultrasound equipment Medical ultrasound is an imaging modality that images the internal body structures in order to detect and characterize any disease affecting them. Images of most of the body structures are created by the sound waves, except for structures with high acoustic impedance, which inhibits the transmission of sound waves; these include air-containing structures such as lungs and intestines and the bony skeleton. High-frequency ultrasound (above 20 000 Hz) sound waves are produced by a probe and the differing waves reflected off the various internal structures are recorded and displayed in the form of an image on a display monitor. The key components of the ultrasound machine are described here. Transducer probe The ultrasound probe is the most important component. It produces and sends sound waves into the body and also receives the reflected signals as echoes. This is achieved through the piezoelectric effect of multiple quartz crystals within the probe, which vibrate rapidly and send out sound waves when an electric current is applied. Probes of different frequencies and configurations are available, including curvilinear probes, linear probes, and intracavitary probes. An appropriate probe can be selected depending on the depth of the tissues to be examined. The frequencies produced range from 1 to 18 MHz. Higher frequency probes have less depth of penetration into the body tissues. This means that small and superficial structures, including the thyroid, neck, breast, scrotum, musculoskeletal, peripheral arteries and veins (including the carotid arteries), neonatal brain, and soft tissue, are examined using a linear high-frequency transducer probe with a frequency of at least 7 MHz. Lower-frequency probes with a frequency of 5 MHz or less enable deeper penetration and are used for examination of the intraperitoneal structures, such as liver and kidney. The thickness of the acoustic crystal determines the frequency of the scan head: a high-frequency probe has a thinner crystal and a low-frequency probe has a thicker crystal. Other key components Ultrasound gel and ultrasound transducers (hand-held probes) Central processing unit (CPU) The CPU is the central control for the ultrasound equipment. The echoes received from the sound waves reflected from the structures of the body are received by the transducer and sent to the front-end processor, which amplifies the echo. This amplified signal is then sent to the CPU. The CPU receives these echoes and converts the sound waves to electrical pulses. The CPU analyses, processes, and interprets the complex data received and converts the electrical signals into an image. This image is sent to the display monitor for interpretation by the radiologist. Keyboard with a screen and multiple functioning knobs The keyboard enables control of all functions of the ultrasound image on the display monitor. At the start of each examination the new patient information details are entered and saved to ensure the unique identity of the study. The keyboard also enables the operator to add image annotation with body marker labels, measurement callipers, and contrast adjustments. There are also time gain control knobs, a track ball, and buttons to freeze and unfreeze images. Control knobs can be used to adjust the depth of the scan area, zoom the image, and provide a dual image facility. Colour Doppler and pulsed wave Doppler measurement controls are important functions that can be used to characterize diagnostic information relating to the vascularity of the structure being examined. Display monitor An ultrasound display monitor is similar to a computer monitor. It receives the analysed processed data from the CPU and displays the real-time images of the scanned body tissues. The display monitor is configured to the printer and enables images to be printed as a hard copy for the patients records and for review by the referring doctor. A storage device with hard disk can be used to store patient information in folders so that the data can be retrieved from the archive. Hard disk with storage device stores patient information in respective folders, with option to retrieve the saved data from the patient archive. Image production The production of an image from sound involves four functions:
Sound waves are produced by the piezoelectric effect of the quartz crystals in the acoustic transducer encased in the plastic casing of the ultrasound probe as described earlier. The frequency of the sound wave produced depends on the frequency of the transducer. Sound waves are then focused by beam forming to produce an arc-shaped sound wave that is emitted from the face of the transducer. This wave travels into the body and is focused at the desired depth. The rubber coating of the transducer helps in transmission of the sound waves. In addition, a water-based ultrasound gel is placed between the surface of the probe and the skin of the patient as a sound-transmitting medium. Reception of the echoes The sound wave sent into the body encounters tissues of different density. Part of the sound waves is lost due to acoustic absorption and part of the sound waves are reflected back to the probe and detected as an echo. Image production The sound waves reflected from the scanned area are returned as echoes. These echoes are amplified by the end processor and sent to the CPU where they are turned into electrical pulses, processed, and transformed into a digital image. Image formation depends on the time taken for the echo to return from when the sound wave was sent into the body and also on the strength of the echo. The stronger the echo, the brighter the image formed. Image display Ultrasound image acquisition is in real time, with constant modification of the scan depth, contrast adjustment, and zoom in or zoom out of the images displayed on the monitor. Once the image is formed, it requires minimal post-processing and is displayed in the Digital Information and Communication (DICOM) format. The radiologist views the images and diagnoses the disease depending on the morphological features of the abnormality examined.
Colour Doppler (also known as colour flow mapping) and power Doppler ultrasound can be used to complement the features shown on B-mode grey-scale ultrasound imaging. The blood flow in a lesion can be detected on colour Doppler, which displays the speed and direction of a Doppler signal in the lesion, depending on the angle at which the sample is obtained. Power Doppler is independent of the angle of blood flow detection and velocity measurements. It displays the strength of Doppler signal and has higher sensitivity than conventional colour Doppler for the detection of flow in the mass lesion. It is especially useful for small vessels with low-velocity flow. For breast lesions, a resistive index (RI) greater than 0.83 and a pulsatility index (PI) greater than 1.6 are considered as signs of malignancy with high sensitivity. Real-time elastography (RTE) RTE is an added feature of breast ultrasound technique that is helpful in the characterization of breast masses. RTE was developed as a technological advancement in use of ultrasound after colour Doppler, for more precise tumour characterization. The concept of ultrasound elastography was introduced in 1991 by Ophir et al. and the first practical diagnostic elastography equipment became available in 2003. Since then, breast ultrasound RTE has been used in combination with conventional ultrasound and mammography to provide information on breast lesions based on non-invasive evaluation of their stiffness. RTE increases the specificity of conventional B-mode ultrasound and enables more precise characterization of breast lesions in cases where ultrasound may be unable to differentiate various benign solid conditions. Its shear wave and strain technologies can be used for tissue compression and can give information regarding tissue deformity and help in the characterization of breast lumps. Ultrasound elastography has an estimated sensitivity of 86.5%, specificity of 89.8%, and diagnostic accuracy of 88.3% in the differentiation of benign from malignant solid breast masses. |

Click on the pictures to magnify and display the legends
Click on this icon to display a case study
25 avenue Tony Garnier CS 90627 69366, LYON CEDEX 07 France - Tel: +33 (0)4 72 73 84 85
© IARC 2025 - Terms of use - Privacy Policy.
© IARC 2025 - Terms of use - Privacy Policy.